
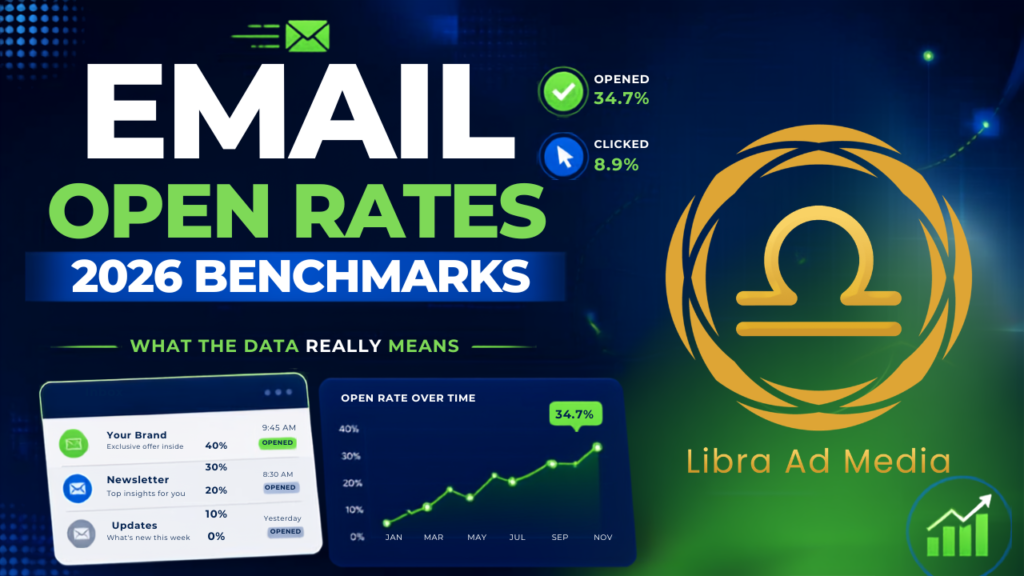
Email Open Rates and Engagement Benchmarks in 2026: What the Data Actually Means
Every year, a new batch of email marketing benchmark reports hits the streets—and every year, marketers cite a one-size-fits-all average open rate as some sort of goal to be attained. That habit is becoming less useful, not more. As inbox providers filter more aggressively and privacy protections continuously redefine what “open” even means, the gap between a benchmark number and what it tells you about your campaign has widened.
This is not simply a roster of averages. It’s a look at why those averages disagree, what’s actually worth tracking in 2026, and how to use benchmarks without getting misled by them.
Why the numbers don't agree with each other
If you pull open-rate and click-through-rate figures from a handful of email service providers’ benchmark reports, you’ll notice they rarely match—sometimes by several percentage points for the same broad “average across all industries” figure. That’s not a data error. It reflects real methodological differences:
- Different customer bases. An ESP’s benchmark reflects its own customers, not the market. A platform popular with small e-commerce shops will report different numbers than one popular with enterprise B2B teams.
- Different definitions of an “open.” Since Apple’s Mail Privacy Protection and similar features have become widespread, opens can be triggered by an image pre-fetch rather than a human reading the email. Some reports adjust for this; others don’t.
- Different time windows and list hygiene practices. A report built from senders with strict list-cleaning habits will show healthier numbers than one that includes stale, unpruned lists.
- Different industry and geography mixes. Publishing and media typically see different engagement patterns than financial services or SaaS.
What this means practically: don’t average the averages. Pick one or two reports from senders that resemble your business—similar industry, similar list size, similar send frequency—and use those as a rough directional reference, not a scorecard.
Benchmarks are not goals.
This is worth stating plainly: an industry benchmark tells you what a large, mixed group of other senders experienced. It does not tell you what a good result looks like for your specific list, your specific audience relationship, or your specific campaign type.
A welcome email and a re-engagement campaign to a dormant segment should never be judged against the same number. Neither should a 5,000-person niche newsletter and a 500,000-person retail list. The more useful comparison is almost always your own historical performance—is this campaign doing better or worse than your last five similar sends? — followed by a peer group that actually resembles you.
What the latest data actually tells us
Looking across how open-rate measurement has shifted since privacy features started affecting inbox behavior, a few patterns are consistent across most credible reporting, even where exact figures vary:
- Open rate is becoming a weaker signal on its own. It’s still useful for spotting subject-line and deliverability problems, but it’s an increasingly unreliable proxy for genuine interest, since a meaningful share of “opens” are now automated.
- Click-through rate and click-to-open rate carry more weight than they used to, because a click requires an actual person to act—something automated pre-fetching can’t fake.
- Segmented and behaviorally triggered sends tend to outperform broad blasts on engagement and revenue-per-email, a pattern that has held up consistently across multiple ESP benchmark reports over the past several years, even as exact percentages shift year to year.
For a small business, the practical takeaway is: stop obsessing over hitting a headline open-rate number, and start watching whether click behavior and conversions are trending in the right direction relative to your own baseline. For an e-commerce brand, it means behavioral triggers (cart abandonment, post-purchase, browse abandonment) usually deserve more attention than the next newsletter subject line test. For B2B, it usually means list quality and lifecycle timing matter more than volume.
Common email marketing advice vs. reality
Common Advice Reality “High open rate = your campaign worked. Privacy features can automatically trigger opens, so they are more of a deliverability signal than a true indicator of interest. Send more emails = get more results.” Increasing frequency without increasing relevance tends to increase unsubscribes and spam complaints faster than revenue. “Personalization is using a person’s first name. First-name personalization has diminishing returns, but behavioral and declared (zero-party) data drive more measurable lift. “Hit ONE ideal benchmark.” Benchmarks vary by dataset, industry, list size, open definition, and timeframe—treat as directional, not universal. A mini-framework for decision-making.
- If you’re just starting out, focus on list quality and a clean welcome sequence before worrying about optimizing open rates.
- If you already have an established list, shift attention from open rate to click-to-open rate and conversion rate; they’re harder to fake and more tied to revenue.
- If engagement is falling over time, check list hygiene first (inactive subscribers dragging down every average) before rewriting subject lines.
- If emails are landing in spam, investigate authentication (SPF, DKIM, DMARC) and sending consistency before touching creative or copy.
- If open rates look strong but clicks are weak, the subject line is working, but the email body or offer isn’t; that’s a content and relevance problem, not a deliverability one.
- If you have a large existing customer database, prioritize segmentation and behavioral triggers over batch-and-blast sends; this is usually where the biggest lift is available without adding volume.
A practical test worth running

Instead of trusting a benchmark, run a controlled comparison against your own list:
Try this: Send the same offer to a comparable, randomly split audience as two versions—one generic, one segmented by past purchase or browsing behavior. Compare click-through rate, conversion rate, and unsubscribe rate between the two groups, sent under the same conditions (same day, similar subject line structure, same send time). The result that matters isn’t which version had the higher open rate—it’s which one drove more clicks and fewer unsubscribes relative to its own group size.
Newsletter vs. automated email: a comparison that actually matters
Newsletter Automated (triggered) email trigger Fixed schedule (weekly, monthly) User behavior (signup, purchase, cart abandonment) Relevance: Same content to a broad segment Tailored to where the recipient is in their journey Typical engagement pattern Engagement tends to decay over the list lifecycle. Tends to outperform broad sends because timing and context are more relevant Best for ongoing relationship-building, brand consistency Revenue recovery, lifecycle moments, high-intent windows Most mature email programs run both—the mistake is treating them as interchangeable and judging them against the same benchmark.
The bottom line
The interesting part of email marketing in 2026 isn’t that automation and AI-assisted personalization are becoming standard—that’s expected. It’s that the metrics marketers have relied on for two decades are quietly becoming less trustworthy on their own, which makes interpretation, not just measurement, the actual skill. A benchmark report can tell you what the industry looked like last quarter. It can’t tell you what to do next. That still requires comparing your own results against your own history, understanding what each metric can and can’t prove, and testing against your specific audience rather than someone else’s average.
A note on the data in this piece: figures referenced here reflect general, well-established patterns in email benchmark reporting rather than a single verified 2026 source. For an updated version with current, cited statistics from specific 2026 benchmark reports (DMA, major ESPs, etc.), current web research should be run and sources linked directly.